User Guide
Geological Framework Model (GFM) Viewer Overview
The GFM Viewer provides a map-based view of GFM version 1.0 dataset. The pages on this site are the GFM viewer page, this user guide, a disclaimer, and a contact information page.
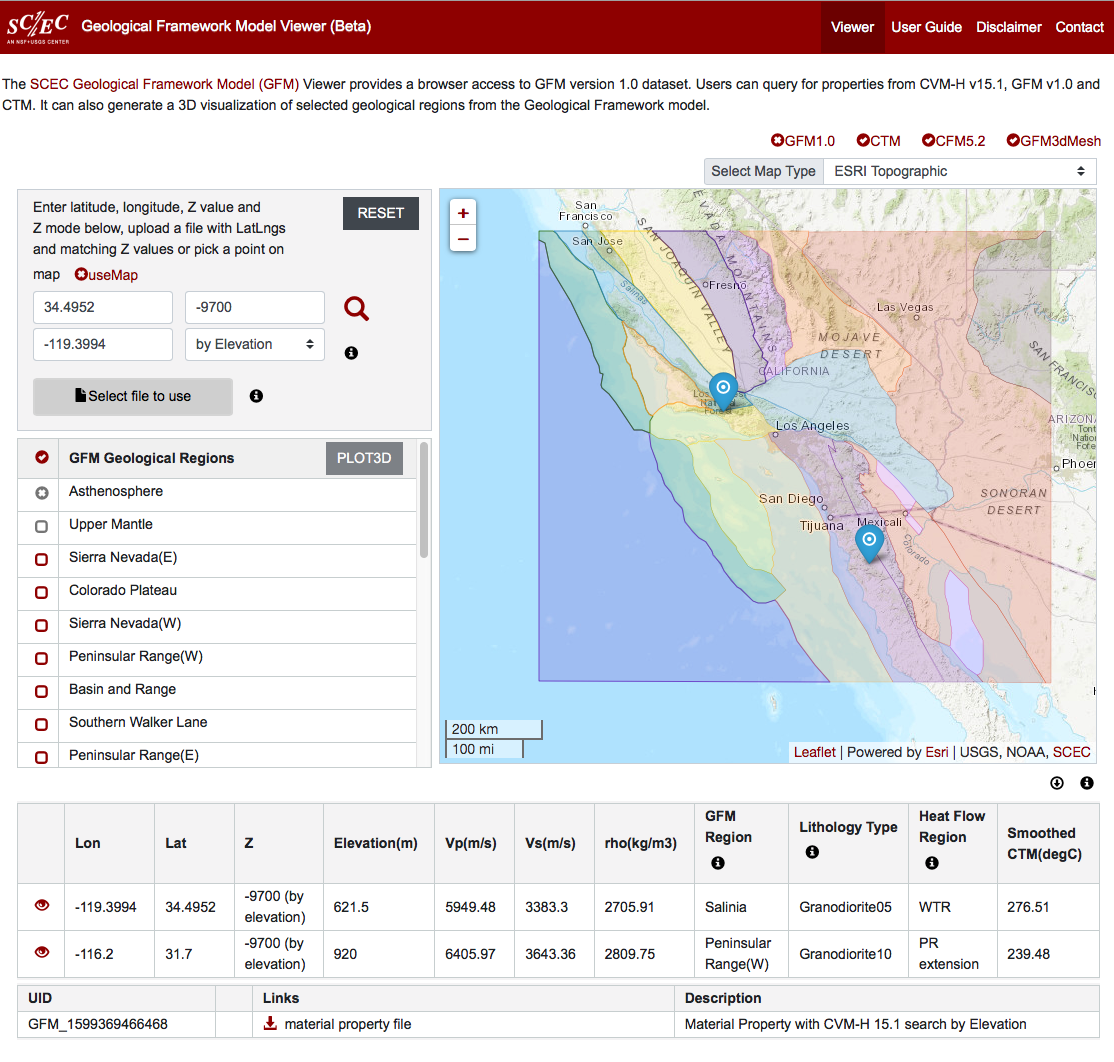
The main interface is on the Viewer Page. When it is first loaded, Upper left is a query dashboard for query material properties. All available geological regions are listed in the box on the lower left and displayed on the 2D map. Click on the checkboxes in the region table to select region to plot in the 3D plotting tool.
This site is a beta version undergoing active testing and review by the GFM community. To report any bugs or issues, please see the contact page.
Query for Material Properties
The site provides two search methods: search by latitude/longitude and Z (depth or elevation) interactively or by selecting a local input file composed of multiples of data points.
When performing a latitude/longitude search, there are two search methods. The first method is to enter the latitude/longitude values into the text boxes, then clicking the search icon (). The second method is to activate useMap and proceed to drop the marker () on a location on the 2D map and click the search icon.
To return to the initial view , click the "RESET" button.
Viewing and Downloading Data
Complete material properties in CSV format are available for download from this site. After retrieved materials properties of desired locations, click on to save locally. For material properties retrieved using input file, there is a special for each file request for this purpose.
Viewing in 3D and the Plot3D tool
This “Plot3D” option is intended to provide potential GFM users with a quick and convenient way to view geological regions in their native 3D environment (UTM zone 11s). This tool currently does not have the ability to plot 3D axes, and a map scale in 3D is not useful because any scale would only be valid at one given distance from the viewer.
The coastline and state boundaries in black. In the bottom right corner, the green arrow points North, pink points East, and yellow points up vertically.
Learning to navigate in 3D takes some practice, so if you get lost or disoriented, try clicking on the “Show Mapview” button in the top right corner to reset to the original mapview.
Browser Requirements
This site supports the latest versions of Firefox, Chrome, Safari, and Microsoft Edge.
About the SCEC Geological Framework Model (GFM)
The SCEC Geologic Framework Model (GFM) viewer provides researchers with access to two essential components of the SCEC Community Rheology model. The current GFM viewer displays two components that include a three-dimensional geologic framework model (GFM) of southern California's crust, and the SCEC Community Thermal Model (CTM) which provide a model of temperatures and pressure in the region. This information provides essential components for a model of southern California's ductile rheology. By combining these model parameters with given strain rate(s), the SCEC CRM will be able to calculate effective viscosity and differential stress throughout the region.
The preliminary GFM comprises 23 provinces, each with a set of lithologic layers. It is shared as lat-lon files of province boundaries, tables with depth intervals and rock types for each province, and petrological descriptions for each rock type. This GFM model is based on an initial definition of 23 lithotectonic units separated by major faults or contrasts in basement lithology and tectonic affinity. In addition, several lateral interfaces are represented: topography/bathymetry, base of basins, base of seismogenic zone, the Moho, and the lithosphere-asthenosphere boundary (LAB). The base of model is the 100km depth level. The surfaces defining the GFM regions can be viewed using the webviewers 3D plotting capabilities.
From the GFM bounding surfaces, a gridded GFM volume was subdivided into regions. The grid has about 900K 10km x 10km x 1km large cells. This gridded volume is accessible through the GFM Webviewer under the GFM3dMesh display options. The gridded volume currently has three layers: crust, upper mantle and asthenosphere. The crustal layer contains all 23 lithotectonic units. Each cell is parameterized with a region identification number from 1 to 41 which is mapped to region name. The large number of regions stems from separation of small slivers at acute corner points of blocks.
The GFM viewer allows users to query 3D points in southern California for lithology type (rock type) based on the GFM region and the depth in the region.
This GFM viewer also provides access to a SCEC CTM that provides estimates of temperatures and thermal properties of the southern California lithosphere. The CTM model accessible through the viewer is described by Thatcher and Chapman (2020), and comprises a suite of geotherms for fourteen distinct heat flow regions (HFRs). These heat flow regions have been extended into to 24 regions to ensure the coverage regions for the GFM and CTM models are equivalent.
CTM data include longitude-latitude coordinates of the heatflow region (HFR) boundaries, and within each HFR, temperatures as a function of depth at 1 km increments from the surface to 100 km. The CTM values returned by the viewer are smoothed to reduce lateral discontinuities in temperature between adjoining HFR's using Gaussian kernels.
References
- Plesch, A., Shaw, J. H., Oskin,M.E., & Maechling, P. J. (2019,08). A volumetric, CFM compatible, Geologic Framework Model (GFM) . Poster Presentation at 2019 SCEC Annual Meeting. SCEC Contribution 9706
- Shinevar, W. J., Behn, M. D., Hirth, G., & Jagoutz, O. (2018). Inferring crustal viscosity from seismic velocity: Application to the lower crust of Southern California. Earth and Planetary Science Letters, 494, 83-91. SCEC Contribution 8944
- Thatcher, W. and Chapman, D. (2020), The SCEC Community Thermal Model, in preparation for J. Geophys. Res.
- Thatcher, W., Hearn, E. H., Oskin, M. E., Montesi, L. G., Hirth, G., Behr, W. M., Plesch, A., & Shaw, J. H. (2019, 08). Preliminary SCEC Community Rheology Model. Poster Presentation at 2019 SCEC Annual Meeting. SCEC Contribution 9833
- Shaw, J. H., Plesch, A., Tape, C., Suess, M., Jordan, T. H., Ely, G., Hauksson, E., Tromp, J., Tanimoto, T., Graves, R., Olsen, K., Nicholson, C., Maechling, P. J., Rivero, C., Lovely, P., Brankman, C. M., & Munster, J. (2015). Unified Structural Representation of the southern California crust and upper mantle. Earth and Planetary Science Letters, 415, 1-15. doi: 10.1016/j.epsl.2015.01.016. SCEC Contribution 2068