User Guide
SCEC Community Velocity Model Explorer Overview
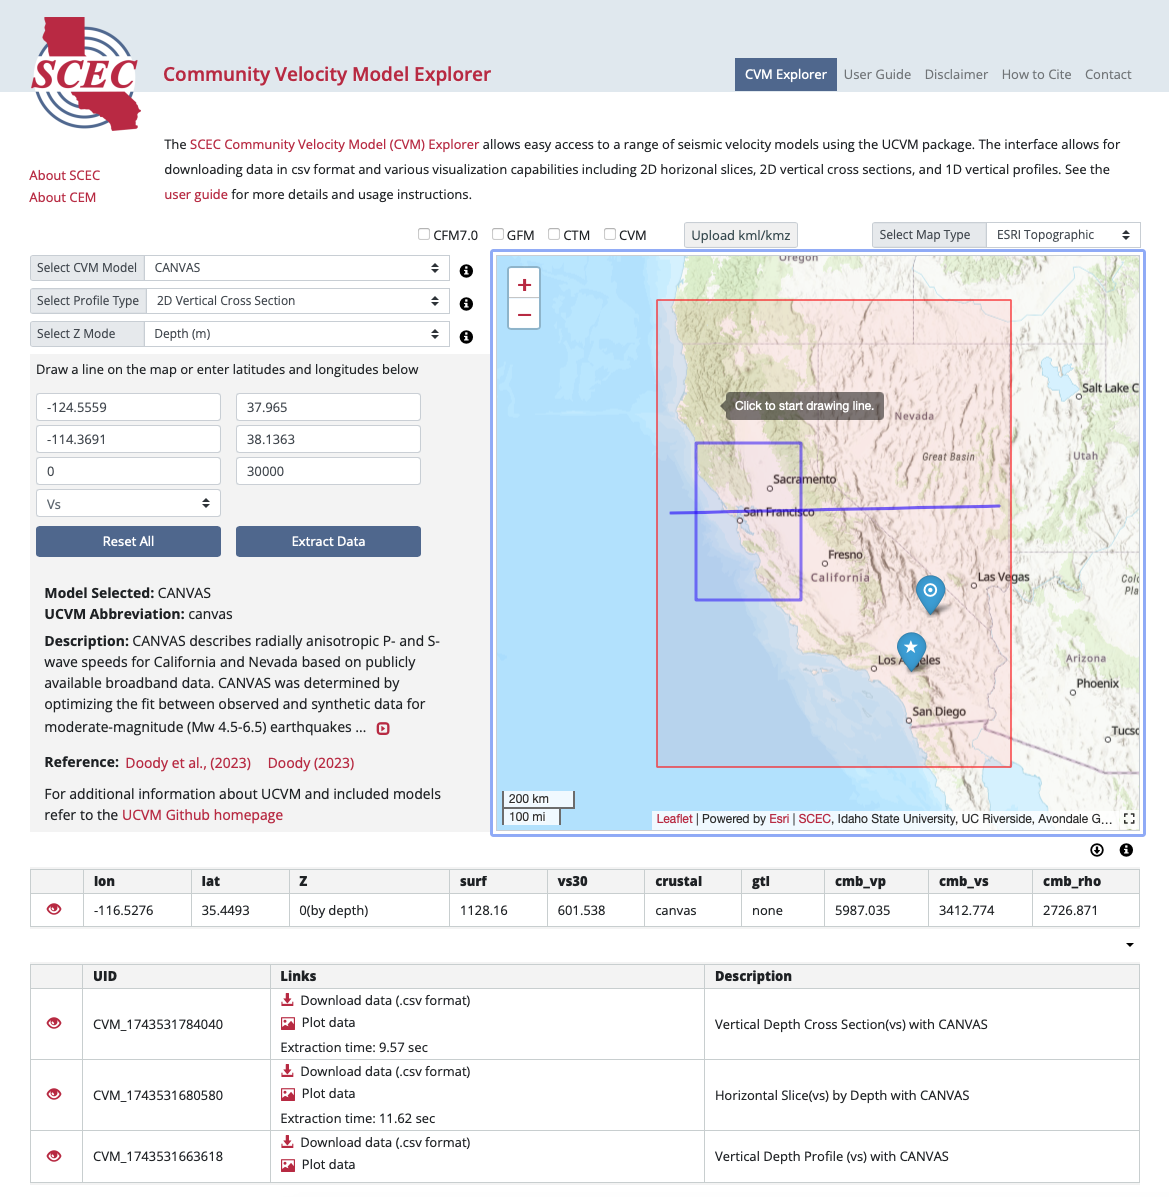
The CVM Explorer provides a user-friendly map-based interface to UCVM version 25.X release. It allows users to extract and visualize velocities of P and S waves and densities from different Community Velocity Models. The CVM Explorer currently has the functionality to produce various visualizations of the models including: 2D horizontal slices, 2D vertical cross sections, 1D vertical profiles, and individual 0D points from the extracted data.
The pages on this site are the CVM explorer page, this user guide, a disclaimer, and a contact information page.
The main interface is on the CVM Explorer Page. The interactive map on the right displays the geographic extent of the selected CVM. On top of the map, there are selection buttons to overlay fault traces from the SCEC Community Fault Model (CFM), geological regions from Geological Framework Model (GFM) from the Community Rheology Model (CRM) , and/or heat flow regions from the Community Thermal Model (CTM). In the top right corner of the interactive map, there is a pull-down menu that allows the base map to be changed. By default, the map shown is ESRI Topographic, but several other base map options are provided.
The map interface has a small default size, but the map interface can be resized by clicking on the black dashed square icon located in the bottom right corner of the interface. Three size options are available, small (default), medium, and full-screen. The medium and full-screen sizes hide some of the tools, so these options are provided for visualization purposes and are not intended to be used when querying the model for download/visualization.
KML/KMZ Uploader
Users can upload their own Google Earth kml/kmz files for display on the 2D map interface. This is intended to allow users to display their own data on the map interface. The kml/kmz uploader currently supports point/line data (kml/kmz) and image overlays (kmz only). If you discover a kml/kmz file that will not display correctly, please contact us at software@scec.org.
Querying CVMs
The CVM Explorer is designed to provide quick access to a wide range of CVMs. These CVMs greatly differ in resolution and methods of construction. We have designed the CVM Explorer to automatically extract approximately 10,000 data points for each model query regardless of the source model resolution. Thus, the extracted data is likely interpolated from the source models. For this reason, we do not recommend using data extracted from the CVM Explorer in simulations. The CVM Explorer is instead designed to provide tools to quickly generate high quality visualizations of the CVMs and extract data for users to use with their own visualization codes. Users that wish to run wavefield and other simulations, should download the full UCVM software package and extract data in the original model resolution.
Model Selection
A subset of UCVM models are deployed and selectable in the CVM Explorer. The boundary of the selected model is displayed on the map and additional model details are provided in the gray rectangle below the search buttons. For model details please refer to the UCVM documentation.
Profile Types
The CVM Explorer currently has the functionality to produce various visualizations of the models including: 2D horizontal slices, 2D vertical cross sections, 1D vertical profiles, and individual 0D points from the extracted data. The Z mode must be Depth (m), except for 1D vertical profiles and 0D points which can be extracted in depth or elevation (m). Once the profile type has been selected, the geographic range can either be manually typed into the boxes, or the ranges can be gathered from mouse clicks on the map. For 2D horizontal slices, the range can be selected by clicking and dragging on the map. For 2D vertical cross sections users can click on the map at the desired starting point and then clicked again on the ending point to set the geographic range. Once the geographic range has been selected, the depth ranges can be specified by filling in the necessary values (in meters) in the boxes. Once everything has been specified, click on “Extract Data” to start data extraction. Warning: CVMs are often very large and data extraction for some models may take several minutes. Once extraction is complete links will show up in the list directly below the Explorer interface. To return to the initial view with no selection, click the "Rest All" button.
Downloading Extracted Data
Once data has been extracted, a link with a downward arrow labeled “Download data (.csv format) will appear at the bottom of the interface. Extracted data can be downloaded in plain text ASCII .csv format, which can be easily parsed by a wide range of programming languages, or Microsoft Excel. The csv files contain headers that describe the contents.
Plotting Extracted Data
Once data has been extracted, a link with a small image icon labeled “Plot data” will appear at the bottom of the interface. Clicking on this image will open the plotting tools interface and a preliminary visualization of the extracted data. The plotting interface has several options to help make the visualizations useful for a wide range of uses. The plots are all generated using the open source Generic Mapping Tools package version 6. Once the selected options have been specified, click the “Replot” button to generate an updated plot. The data does not need to be re-extracted to change plot parameters and replotting usually only takes a few seconds to generate a new plot. Note that plots contain the necessary information in the titles so users reproduce plots in the future, if needed. The plot options are described below.
interp mode: This turns on/off interpolation of the extracted data using the splines in tension algorithm implemented in Generic Mapping Tools with a tension value of 0.2. Interpolation has the result of smoothing the data, but may produce undesirable results for discontinuous data and may not be appropriate for all models/visualizations.
Query Points: When selected the extracted data points are plotted, which is useful to better understand the resolution of the plotted data. Note that all points are interpolated by UCVM when extracting the data from the CVMs and all plots should contain approximately 10,000 data points.
CFM 7.0 faults: When selected, plots the fault traces of the SCEC Community Fault Model. Blind faults are indicated by dashed lines.
Plot cities: When selected, selected regional cities are plotted on maps.
Select Parameter: Users can specify whether Vp, Vs, or density is plotted.
Map Padding: Only available on 2D vertical cross sections and 1D vertical profiles. These plot types plot the data on the left and a location map on the right. Depending on the geographic extent of the extracted data, the map may show no identifiable geographic features. The map padding (in degrees longitude/latitude) sets how far the map region should extend beyond the extracted cross section or 1D profile. Larger map padding makes the location map cover a larger geographic area. All maps are plotted in a simple mercator projection.
Select Colormap: Three commonly used colormaps are provided: seis, rainbow, and plasma. Plasma is perceptually uniform and colorblind-friendly.
Set Plot Range: This allows the user to specify and force the z-range of the plotted data. It is sometimes useful to force a z-range so plots of two different data sets can be directly compared. The default values shown are the exact range of the extracted data.
Replot: Generates a new plot with the currently selected parameters. Data is not re-extracted, so this typically only takes a few seconds.
Save PNG/PDF: Saves the current plot in .png or .pdf format.
Window Options: Buttons are provided to open the plotting interface in a new window, or to close the plotting interface and return to the main CFM Explorer interface.
Browser Requirements
This site supports the latest versions of Firefox, Chrome, Safari, and Microsoft Edge.
About the SCEC Unified Community Velocity Model (UCVM)
More information about the UCVM can be found at: https://www.scec.org/research/ucvm